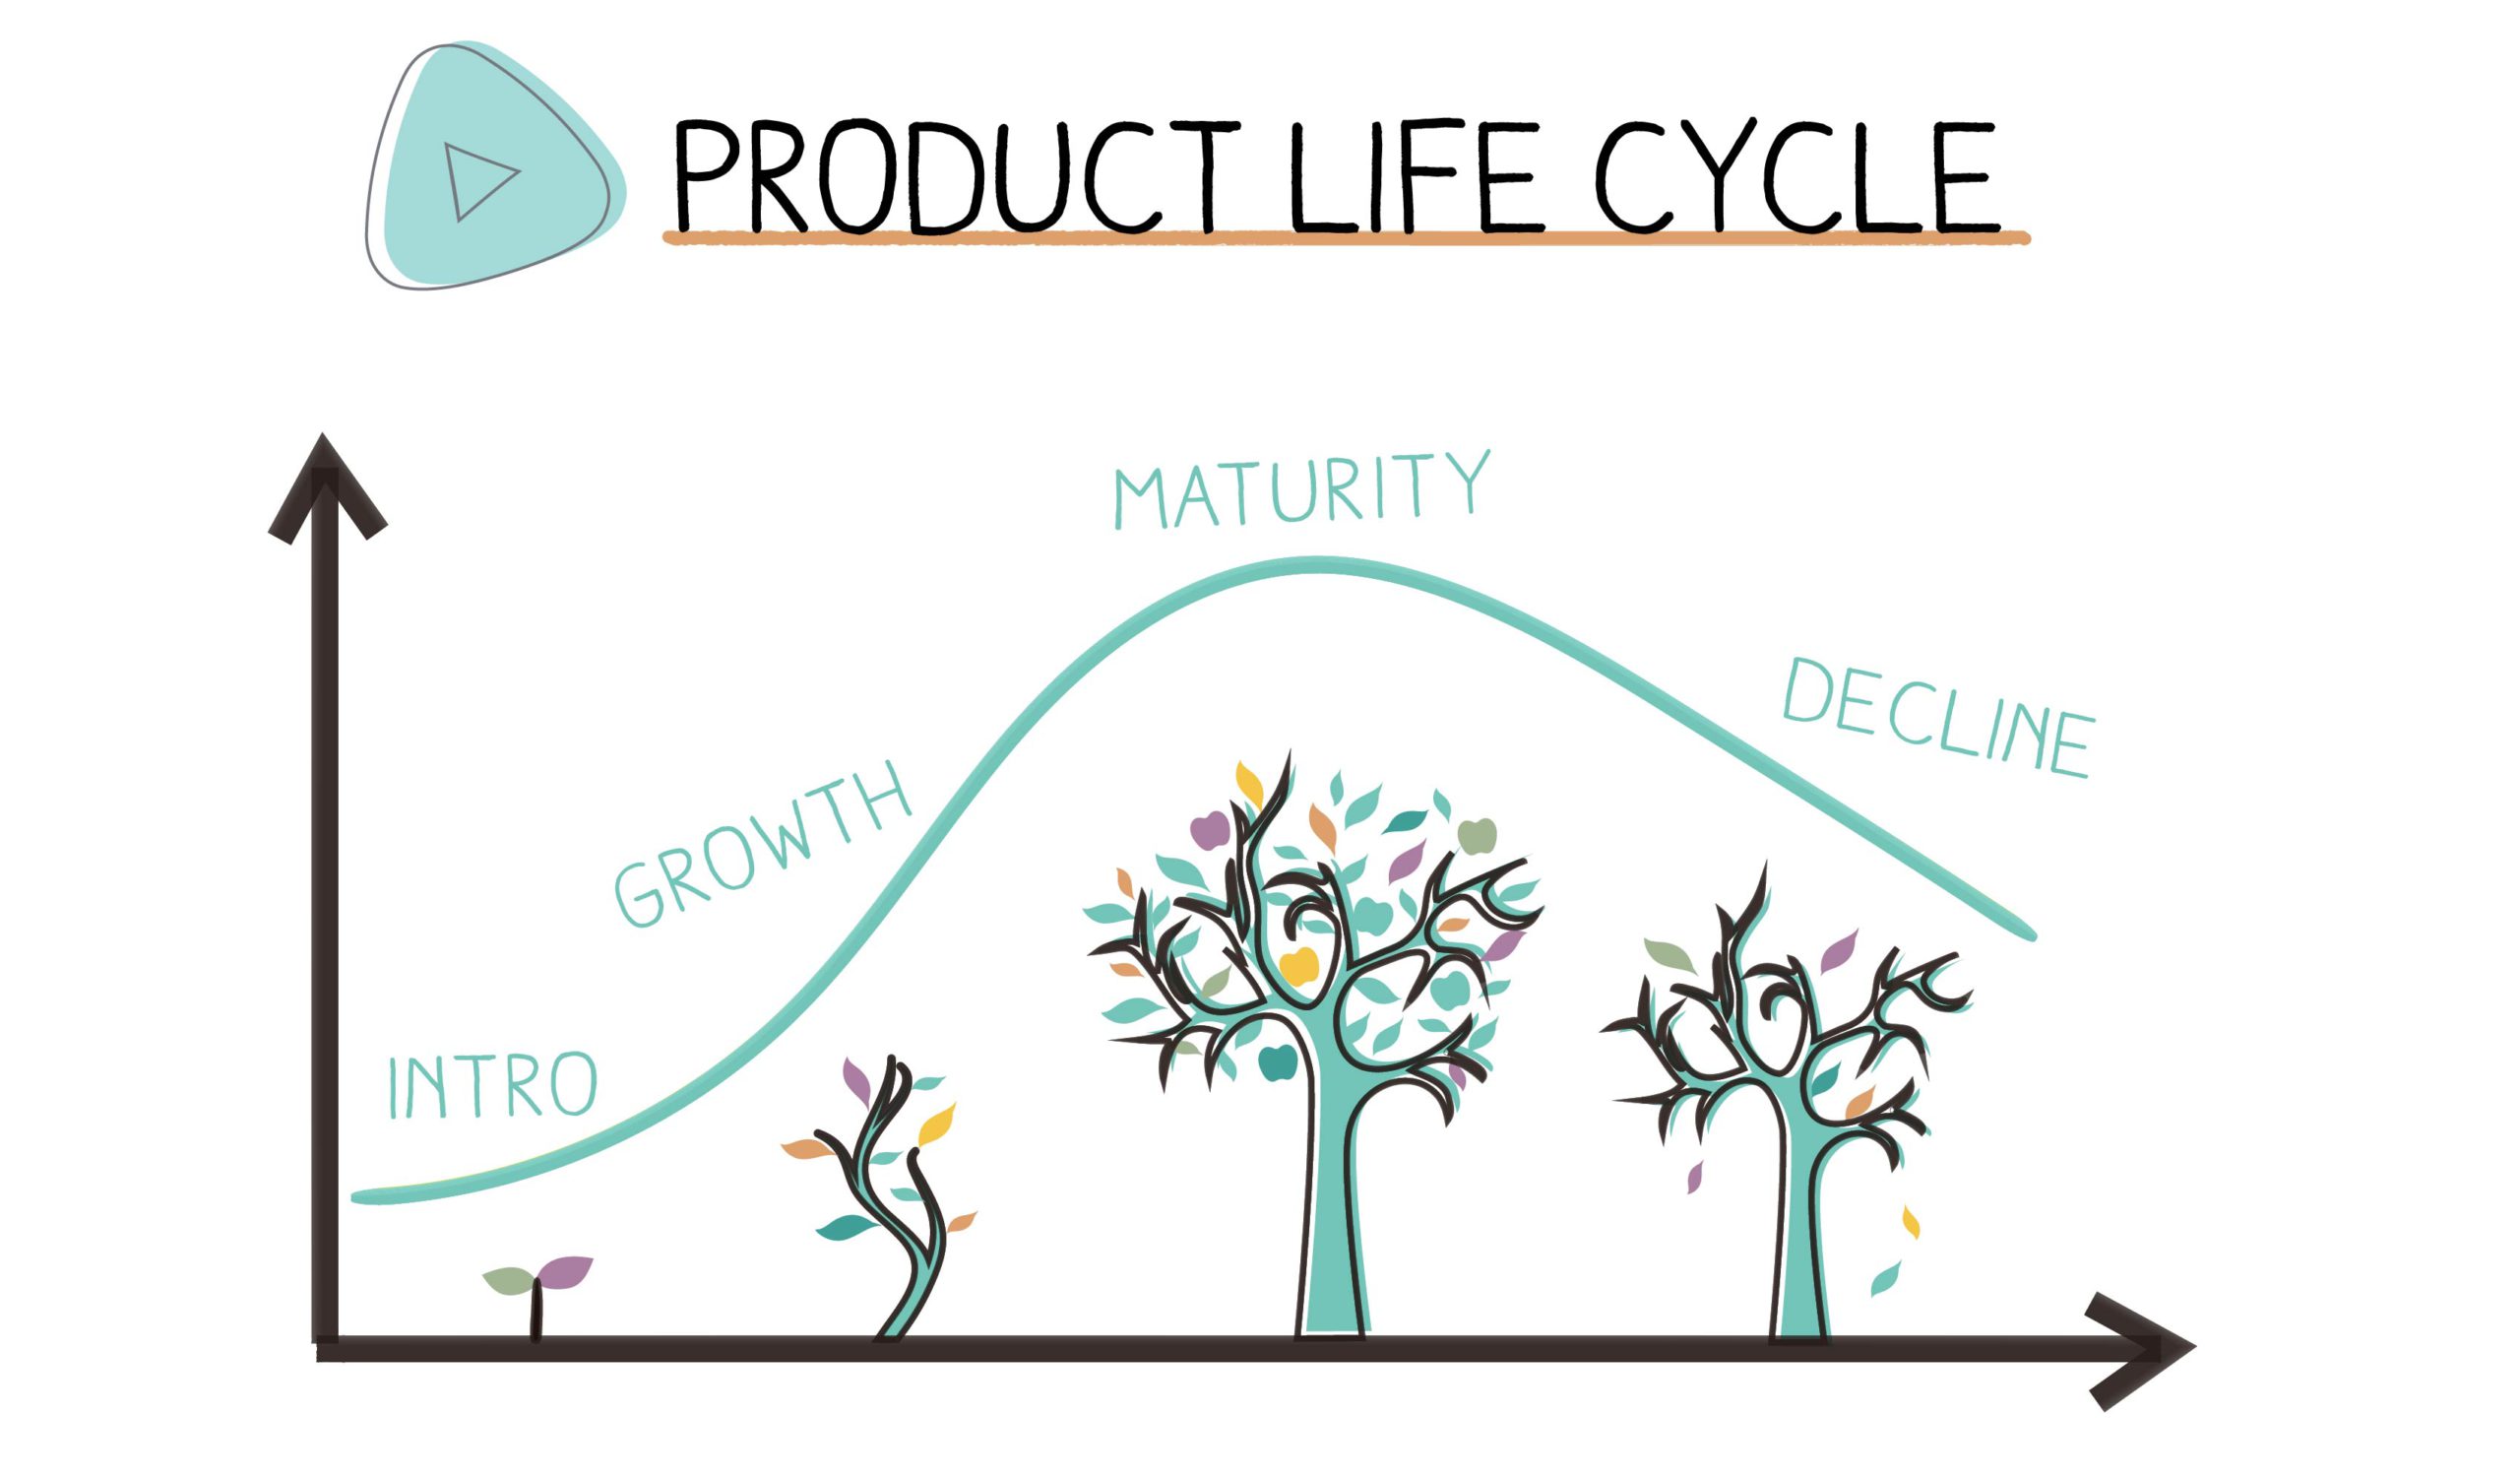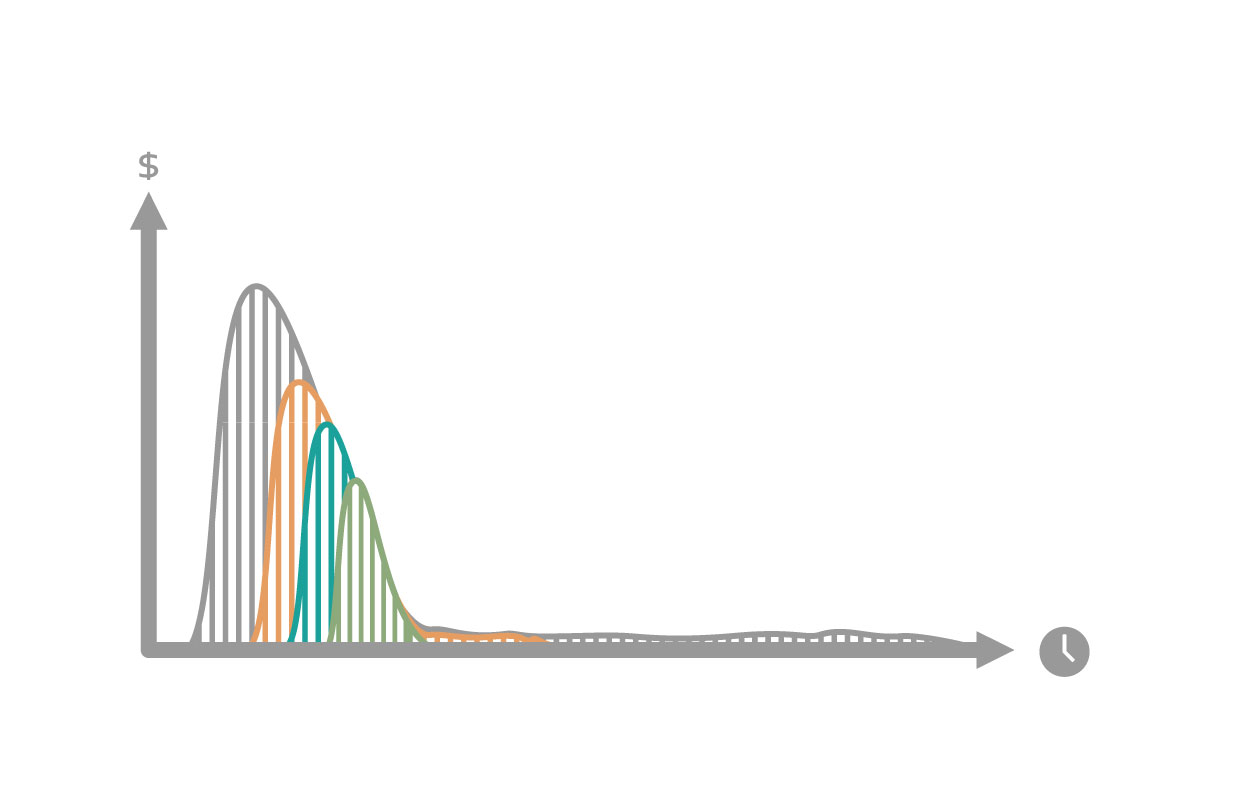
The Value-acquisition lifecycle (VAL) curve (function ) shows the rate of value acquired over time. The area under the curve is the total value acquired. The length on the x-axis is the lifecycle – the period of the time while the product or service or feature is available and generating a benefit. The graphics show different lifecycle value acquisition curves and how the curve would change if there is a delay in delivery and availability to create value.
To learn more about value-acquisition lifecycle curve (function) and its types you can watch the video or read the description below.
There were 11 types of value-acquisition lifecycle curves developed. They describe the most common and frequent cases of generating value over time.
1. One-off opportunity with an expiry date
The impulse function implies that there is a one-off opportunity to gain a benefit (make money) and after that opportunity, the chance is gone.
A customer with a remaining annual budget approaches you to spend the money before the new fiscal year. You either take the opportunity before the expiry date or lose the sale.
![app-graphics-[Recuperado]2](https://mauvisoft.com/wp-content/uploads/2020/12/app-graphics-Recuperado2.jpg)
2. Very front loaded
80 percent of the benefit is realized in the first 20 percent of the lifecycle.
A ski manufacturer issues new models every year in November, and most of the skis are sold in the first three months of what is a one-year lifecycle.

3. Front loaded
80 percent of the benefit is realized in the first 50 percent of the lifecycle.
A bicycle manufacturer, as in previous example, issues new bicycles every year in November–December, but the majority of sales happen in the beginning of the season—in spring—and drop off toward the end of the summer.
![app-graphics-[Recuperado]-10](https://mauvisoft.com/wp-content/uploads/2020/12/app-graphics-Recuperado-10.jpg)
4. Bell curve, no catch up
A bell curve with “no catch up” implies that there is a network effect in the marketplace that gives the first mover an advantage that cannot be taken away later.
This network-effect, first-mover advantage is often associated with technology platforms such as operating systems, productivity suites, mobile telephony standards, messaging and communications tools, and social media networking.
![app-graphics-[Recuperado]](https://mauvisoft.com/wp-content/uploads/2020/12/app-graphics-Recuperado.jpg)
5. Bell curve with catch up
A bell curve with catch up has no first-mover advantage, and second and subsequent movers can catch up and even overtake an early market mover.
The first car manufacturer that introduced LED lights in the market had an advantage, and it took one year for a second manufacturer to offer the same technology. Then it took several years for other market players to catch up. Nevertheless, the first player didn’t have a lock-in market effect, and it didn’t affect competitors’ sales.
![app-graphics-[Recuperado]-12](https://mauvisoft.com/wp-content/uploads/2020/12/app-graphics-Recuperado-12.jpg)
6. Back loaded
80 percent of the benefit is realized in the last 50 percent of the lifecycle.
A hotel’s Easter marketing campaign starts after the New Year (90–100 days’ lifecycle). Most of the reservations are made in the second half of the lifecycle.
![app-graphics-[Recuperado]-6](https://mauvisoft.com/wp-content/uploads/2020/12/app-graphics-Recuperado-6.jpg)
7. Very back loaded
80 percent of the benefit is realized in the last 20 percent of the lifecycle.
A conference organizer offers an event in a local region or metropolitan area aimed at attendees from that geographical region. Unless there is a perceived scarcity of tickets, attendees wait until the last 20 percent of the lifecycle before purchasing a ticket.
![app-graphics-[Recuperado]-11](https://mauvisoft.com/wp-content/uploads/2020/12/app-graphics-Recuperado-11.jpg)
8. Constant rate
The constant rate function models the benefit for things such as cost-saving features.
When the product or service is deployed, cost is saved—perhaps workers are made redundant. Consequently, if we had that feature today, we would have the savings tomorrow, and the amount saved is fixed and constant.
![app-graphics-[Recuperado]-7](https://mauvisoft.com/wp-content/uploads/2020/12/app-graphics-Recuperado-7.jpg)
9. Bell curve extended, decaying life, decaying loyalty
These models an extended but shortening lifecycle, together with decaying loyalty. These are situations where a delay in releasing a product, feature, or service beyond the desired date has little impact due to customer loyalty, technology lock-in, or monopoly of supply or limited choice in the market. However, long delays cause the lifecycle period to shorten and loyalty to drop off.
Loyal customers will wait for their favorite brand (e.g., mobile phones, laptops, tablets) to release the product with the newest technology (e.g., processor, video chip sets, cameras, etc.). But the delay reduces both the loyalty and the lifecycle of the product because underlying technologies will be replaced in their own independent lifecycle.
![app-graphics-[Recuperado]4](https://mauvisoft.com/wp-content/uploads/2020/12/app-graphics-Recuperado4.jpg)
10. Bell curve, extended life, decaying loyalty
This models an extended lifecycle, with decaying loyalty over time. These are situations where a delay in releasing a product, feature, or service beyond the desired date has little impact due to customer loyalty, technology lock-in, or monopoly of supply or limited choice in the market.
Microsoft Windows and Apple iPhone/iOS are both examples, but more subtly, so is the next album from a popular rock band such as Depeche Mode or Coldplay. Depeche Mode release albums on a four-year cadence, but were there to be a delay, the loyal fans would wait and still buy the album. However, longer delays eventually cause loyalty to drop off.
![app-graphics-[Recuperado]-13](https://mauvisoft.com/wp-content/uploads/2020/12/app-graphics-Recuperado-13.jpg)
11. Last-minute decay
Immediate benefits regardless of the delay, however, last-minute results in a rapid drop-off in realized benefits.
This models a business such as promoting a pop concert for a popular artist, such as Taylor Swift. If the tickets go on sale today, the whole stadium is sold out within hours. If we delay a week or a month, we still sell out. The perception of scarcity means that the sales are immediate regardless of the delay unless we wait to the last minute without announcing the event.
![app-graphics-[Recuperado]-5](https://mauvisoft.com/wp-content/uploads/2020/12/app-graphics-Recuperado-5.jpg)
To learn more about value acquisition lifecycle curve check the “Triage” chapter in Appendix D in Kanban Maturity Model book or explore the Triage chapters on kmm.plus.
Download the Triage Tables Poster to determine the class of service for your work request here. Learn how to apply triage approach in your work from Kanban Maturity Model course.

Recent Comments