Having instrumentation data from your process doesn`t mean you now understand your lead time distribution. Let`s explore how to read a lead time histogram and use this data in the communication with your client.
Step 1 – Building the Lead Time Histogram
Let`s start with understanding the main term:
Lead time – is the time you need to deliver the service / to fulfill the request. It is calculated from the commitment point (for example, the “requested” column) to an agreed ready-for-delivery or acceptance point that means the work is done (for example “Done” or “Deployed” column on a Kanban board). Analysing the lead time of tickets gives us an understanding of how long before we need to take delivery, we must place an order and have it accepted.
To build a Lead Time histogram you should remember the following:
- x-axis = time (days of lead time of the tickets);
- y-axis = frequency (the quantity of the tickets, that took a certain lead time (x-axis) which have gone through the board over a certain period).
Example:
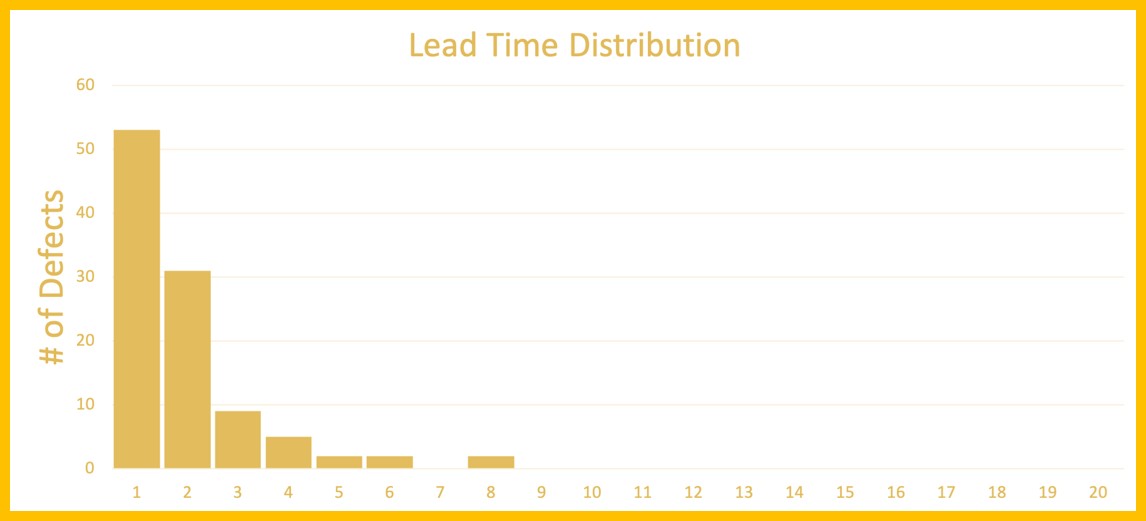
Let`s imagine you are analyzing data from 3 months of the work. You know that the minimum lead time of a ticket on your board is 1 day. After 3 months you have 53 tickets with 1-day lead time – which means, that your first data point will be 1 on the x-axis and 53 on the y-axis, and so on.

Note: if the minimum lead time is greater than 1 day, but 3 days, for instance, it means your chart starts from 3 as a starting point (see another example below).
Step 2 – Analyzing your lead time distribution
We believe that a widely spread concept of average is not precise enough. Let`s define “mode”, “medium” and “mean” for your lead time distribution and see how we can use it as a more precise “average” in your communication with the client.
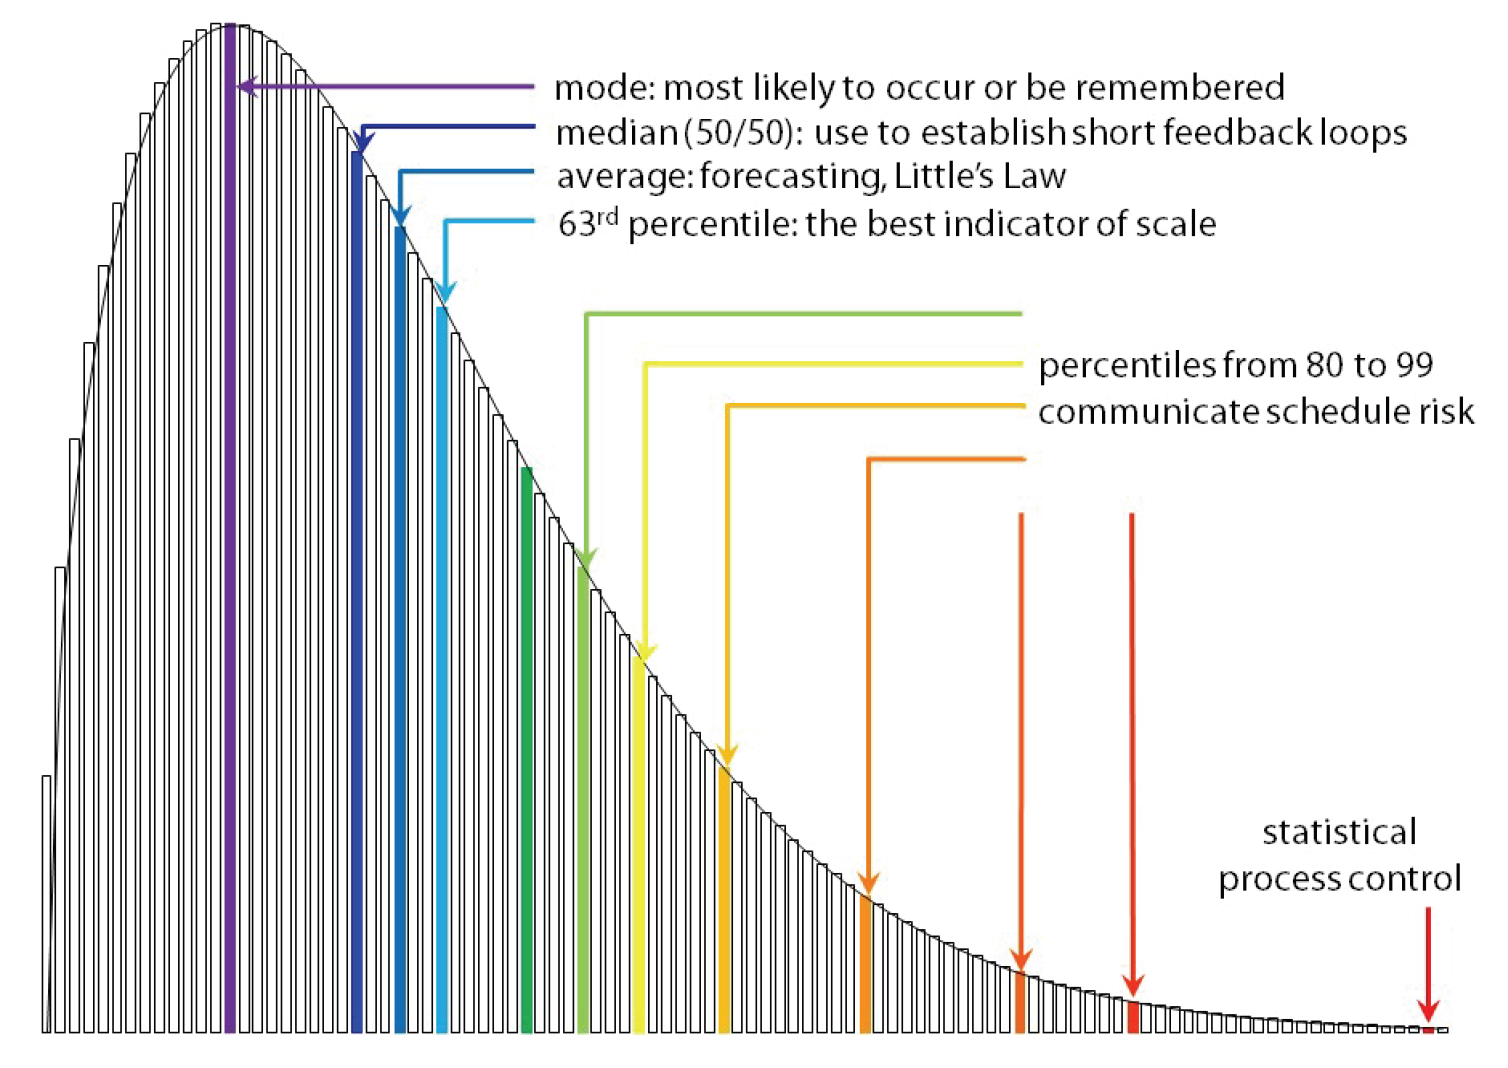
The mode – is the most commonly occurring lead time in the data set = the biggest quantity of tickets you have with this lead time. We tend to remember this lead time because it happens the most often, this is the top of the hill of our lead time histogram, the peak of the curve.
The median – is the 50th percentile. Means half of the data (the quantity of the tickets in this case) is on the one side of the histogram and the other half – on another. If the median is twenty days, it means that half of the items processed took less than twenty days, while the other half took twenty or more days. Every other one is less than the median value, and the other half is greater than the median value.
The mean – is the arithmetic average: sum up the value of all the data points (lead time days) and divide by the number of points (the quantity of the tickets). The word “average” is usually used to refer to this arithmetic mean.
We need to understand, that the mean tends to accelerate away from the mode and the median as the tail extends farther to the right with longer lead times (creating a fat tail). A fat tail affects the mean much more than it affects the median and is unlikely to impact the mode at all. Understanding this is important for planning, risk management, and customer satisfaction.

Step 3 – Identify your 85%-ile and 98%-ile
We have already identified that the median – is the 50th percentile. To define the 85%-ile we need to determine what is the lead time when 85% of the data points are being processed (see the image below). We like the 85%ile because it represents 6 out of 7. Only 1 out of 7 takes longer than the 85%ile point.

How to use this data in communication with your client
All this data will give you more trustworthiness because the averages are simply not enough to communicate the delivery capability. To be reliable use at least two data points: the average (mean) and a high percentile (e.g. 85%). Why? Let`s have a look at our example below.
Example:
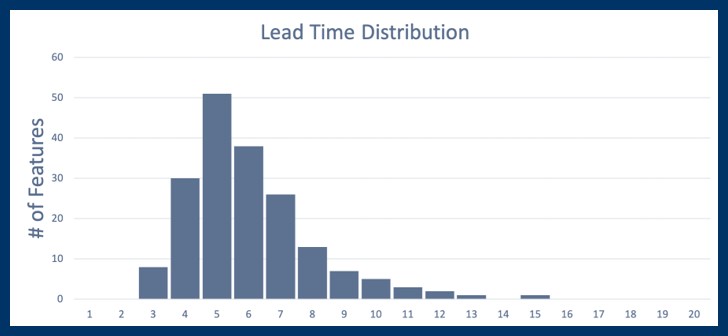
- the mode (most frequent): 5 days;
- the mean (arithmetical average): 6 days;
- 85%-ile (85% of items are done): 8 days;
- 98%-ile (98% of items are done): 12 days.
Imagine you are talking to your client and you are considering committing to 5 days delivery. You remember you often deliver in 5 days; you feel you can make it and you don`t either want to sound too slow in delivering.
But knowing your lead time gives you more variations to make a proper commitment and be more reliable for your client. Now you know that your mean is 6 days and 85%-ile is 8 days. The smart solution is to say, “we will deliver it in 5-8 days”. If you anticipate that this particular requestmay take longer, just add “as a maximum you will have it 12 days”. This way you will have many more chances to deliver in time and gain a trustworthy reputation with your client.
You delivered in 5 days – good for you, you`ve made your client happy. In 8 days – you delivered in time, in 12 days – the delivery is still within the SLE.
Learn more about Kanban studies in Kanban Maturity Model book or get access to full book content online using kmm.plus. Attend training at the David J Anderson School of Management to learn more about advanced Kanban studies and how they can help your business, or find your local trainer at Kanban University to start your Kanban journey.

Recent Comments